Safety TradeOverview
Safety Trade plots a deterministic set of adaptive support levels anchored to 4H data and overlays them on any chart timeframe. The script does not use lookahead or future data. Line styles (color/width/type) are user-editable in the Style tab; logic parameters are fixed to keep results uniform across users.
What makes it different
All computations are centralized on 4H, then the finished values are displayed on lower or higher timeframes. This reduces parameter drift, simplifies cross-user comparisons, and avoids ambiguous “moving targets.”
Method (high level)
On 4H, a smoothed baseline is built from recent lowest lows using a moving average. From that baseline, LL2/LL3/LL4 are derived and smoothed on 4H as well. A deterministic mid-line between LL2 and LL3 is used internally (no bar-index tricks or animations). Five empirical extra levels are then computed between LL4 and LL3 using fixed multipliers: 5.33, 4.37, 3.52, 2.95, 2.30. These are not classic Fibonacci; they serve as research/visual guideposts only.
How to use (practical playbook)
Timeframe and confirmation: Values finalize on the 4H close. Confirm setups on 4H candles; use lower TFs only to fine-tune entries once a 4H condition is met.
Reading the levels: The LL4→LL3 corridor is an adaptive 4H support envelope. Level 1…Level 5 are non-linear subdivisions inside this corridor for staging partial exits, re-entries, and trailing stops. Basic bias: above LL3 with rising slope = bullish context; persistent 4H closes below LL4 with retests from below = bearish context.
Long setups:
• Rebound from LL4 (mean-reversion long): Wick through LL4, then a 4H close back above LL4. Entry next bar or on a small pullback; stop = LL4 − 0.5–1.0 × ATR(14, 4H). Targets: L5 → L4 → L3 (e.g., 30/30/40). After first take-profit move stop to breakeven, then trail under the next lower level.
• Retest of LL3 from above (trend-continuation long): Confirmed 4H close above LL3, then pullback holding LL3. Stop slightly below LL3 or below the retest swing low. Targets: structure highs or ladder via L3→L2→L1.
Short setup (mirror): 4H close below LL4, retest fails from below; stop above LL4; manage via structure/ATR and trail above swing highs or above the nearest level.
When to stand aside: High-impact news spikes; mid-corridor chop with no tests of LL4/LL3; before a decisive 4H close.
Confluence: Higher-TF market structure (D/1W), volume/OBV/MFI, and candle behavior right at LL4/LL3.
Risk: Keep per-trade risk small (e.g., 0.5–1%). Prefer partial take-profits over all-or-nothing. If volatility expands, widen stops slightly (ATR-based) and reduce size to keep risk constant.
Common mistakes: Treating lines as guaranteed reversal points; entering off a lower-TF touch without 4H confirmation; claiming performance on synthetic charts; fighting a strong down-slope below LL4.
Multi-timeframe behavior
On lower chart timeframes, values can shift intrabar until the current 4H candle closes. After the 4H close, values are fixed for that 4H segment. Lookahead is off.
What this is not
Not a strategy and not a signal generator. No claims about accuracy or ROI. Past performance does not guarantee future results.
Compatibility and scope
Pine v5, overlay, user-editable line styles. Works on any symbol/timeframe; all computations are centralized on 4H.
Changelog
v1.0 — Initial public release: 4H-anchored processing, no lookahead, user-editable styles, five empirical extra levels.
Disclaimer
For informational and educational purposes only. Not financial advice. Use at your own risk.
In den Scripts nach "take profit" suchen

EMA+RSI Buy/Sell with Fibonacci GuideSingle-Instance EUR/USD & GBP/USD Trend+MACD ATR EA
Purpose:
This EA is designed for automated Forex trading on EUR/USD and GBP/USD. It identifies trend-based trading opportunities, dynamically calculates position sizes based on your available capital and risk percentage, and manages trades with ATR-based stop-loss and take-profit levels, including optional trailing stops.
Key Features:
Auto Pair Selection:
Compares the trend strength of EUR/USD vs GBP/USD using a combination of EMA slopes and MACD direction.
Automatically trades the stronger trending pair.
Trend & Signal Detection:
Uses Fast EMA / Slow EMA crossover for trend direction.
Confirms trend with MACD line vs signal line.
Generates long and short signals only when trend and MACD align.
Dynamic SL/TP:
Stop-loss and take-profit are calculated based on ATR (Average True Range).
Supports optional trailing stops to lock in profits.
Position Sizing:
Automatically calculates micro-lot sizes based on your capital and risk percentage.
Ensures risk per trade does not exceed the defined % of your account equity.
Chart Visualization:
Plots Fast EMA / Slow EMA.
Displays SL and TP levels on the chart.
Shows a label indicating the active pair currently being traded.
Alerts:
Generates alerts for long and short signals.
Can be used with TradingView alerts to notify or trigger webhooks.
Single Strategy Instance:
Fully compatible with Pine Script v6.
Only one strategy instance runs on the chart to prevent “too many strategies” errors.

Expected Value Monte CarloI created this indicator after noticing that there was no Expected Value indicator here on TradingView.
The EVMC provides statistical Expected Value to what might happen in the future regarding the asset you are analyzing.
It uses 2 quantitative methods:
Historical Backtest to ground your analysis in long-term, factual data.
Monte Carlo Simulation to project a cone of probable future outcomes based on recent market behavior.
This gives you a data-driven edge to quantify risk, and make more informed trading decisions.
The indicator includes:
Dual analysis: Combines historical probability with forward-looking simulation.
Quantified projections: Provides the Expected Value ($ and %), Win Rate, and Sharpe Ratio for both methods.
Asset-aware: Automatically adjusts its calculations for Stocks (252 trading days) and Crypto (365 days) for mathematical accuracy.
The projection cone shows the mean expected path and the +/- 1 standard deviation range of outcomes.
No repainting
Calculation:
1. Historical Expected Value:
This is a systematic backtest over thousands of bars. It calculates the return Rᵢ for N past trades (buy-and-hold). The Historical EV is the simple average of these returns, giving a baseline performance measure.
Historical EV % = (Σ Rᵢ) / N
2. Monte Carlo Projection:
This projection uses the Geometric Brownian Motion (GBM) model to simulate thousands of future price paths based on the market's recent behavior.
It first measures the drift (μ), or recent trend, and volatility (σ), or recent risk, from the Projection Lookback period. It then projects a final return for each simulation using the core GBM formula:
Projected Return = exp( (μ - σ²/2)T + σ√T * Z ) - 1
(Where T is the time horizon and Z is a random variable for the simulation.)
The purple line on the chart is the average of all simulated outcomes (the Monte Carlo EV). The cone represents one standard deviation of those outcomes.
The dashed lines represent one standard deviation (+/- 1σ) from the average, forming a cone of probable outcomes. Roughly 68% of the simulated paths ended within this cone.
This projection answers the question: "If the recent trend and volatility continue, where is the price most likely to go?"
Here's how to read the indicator
Expected Value ($/%): Is my average trade profitable?
Win Rate: How often can I expect to be right?
Sharpe Ratio: Am I being adequately compensated for the risk I'm taking?
User Guide
Max trade duration (bars): This is your analysis timeframe. Are you interested in the probable outcome over the next month (21 bars), quarter (63 bars), or year (252 bars)?
Position size ($): Set this to your typical trade size to see the Expected Value in real dollar terms.
Projection lookback (bars): This is the most important input for the Monte Carlo model. A short lookback (e.g., 50) makes the projection highly sensitive to recent momentum. Use this to identify potential recency bias. A long lookback (e.g., 252) provides a more stable, long-term projection of trend and volatility.
Historical Lookback (bars): For the historical backtest, more data is always better. Use the maximum that your TradingView plan allows for the most statistically significant results.
Use TP/SL for Historical EV: Check this box to see how the historical performance would have changed if you had used a simple Take Profit and Stop Loss, rather than just holding for the full duration.
I hope you find this indicator useful and please let me know if you have any suggestions. 😊

ICT Entry Models (Riz)The ICT Entry Models Indicator is a complete framework built to help traders visualize and apply multiple Institutional concepts on a single chart. Instead of relying on one entry technique, this tool combines 14+ ICT entry models and evaluates them under a unified structure. Each model is detected independently but filtered through a multi-factor confluence engine that considers liquidity, higher-timeframe structure, premium/discount zones, and session context. This ensures only high-probability setups are highlighted.
What This Indicator Does
⦁ Detects and plots ICT-based entry models such as: Fair Value Gaps, Order Blocks, Breakers, Liquidity Grabs, Stop Hunts, Asian Range Breakouts, Silver Bullet setups, Power of Three, Judas Swing, Unicorn model, Market Maker models, Previous Day High/Low breaks, and others.
⦁ Automatically validates entries using higher timeframe confirmation and confluence filters.
⦁ Provides risk management tools with structural stop-loss, ATR-based SL, TP1/TP2 targets, and R:R calculations.
⦁ Displays visual trade labels showing direction, strength, and expected risk/reward.
⦁ Includes a performance dashboard that tracks win rates, session stats, and risk outcomes.
How It Works
Each entry model is activated through custom detection logic. The script checks for key conditions like displacement, imbalance, BOS/CHoCH, liquidity sweeps, and premium/discount zones. When multiple models align, the indicator assigns a signal strength rating.
⦁ Weak setups: Highlighted but marked lower confidence.
⦁ Strong setups: Require confluence of liquidity, structure, and time-based filters (e.g., killzones).
⦁ The indicator then calculates a safe stop-loss placement (always on the correct side of price) and take-profit levels based on Goldbach ratios and volatility expansion.
Inputs
⦁ Model Toggles: Enable/disable individual entry models (e.g., FVG only, OB only, or full confluence).
⦁ Confluence Filters: Higher-timeframe structure, premium/discount zones, volatility thresholds.
⦁ Risk Management Settings: ATR multiplier, fixed SL/TP options, R:R target adjustments.
⦁ Dashboard & Visuals: Choose which stats, labels, and levels appear on chart.
How to Use
1. Apply the indicator to any forex, crypto, or index chart.
2. Select your timeframe. For scalping, use 1–5m with HTF confirmation. For day/swing trades, use 15m–1H with HTF overlays.
3. Toggle your preferred entry models (e.g., FVG + Liquidity Sweep) or enable all for confluence.
4. Watch for strong confluence signals: entry marker + calculated SL/TP + dashboard confirmation.
5. Use the signals as decision support not as automated buy/sell triggers.
Notes & Tips
Best used in liquid markets (Majors, Gold, Indices, BTC/ETH).
HTF confirmation greatly improves accuracy e.g., align 1m entries with 15m structure.
Combining time-based models (Silver Bullet, Killzones) with structural models improves precision.
Disclaimer
This tool is for educational and research purposes only. It is not financial advice, nor does it guarantee profitability. All trading involves risk, and users should test thoroughly before applying live.

Ultimate📖 Indicator Description – Ultimate
The Ultimate Indicator is a complete charting framework that combines linear regression channels, dynamic deviation bands, EMA ribbons, volatility spreads, and entry/exit markers. It is designed to help traders visualize trend direction, potential reversals, and trade setups with precision.
🔹 What You See on the Chart
Channel Lines (Linear Regression Bands)
Green dotted line (median): Fair value trendline based on regression.
Red dashed line (upper band): Dynamic resistance zone.
Blue dashed line (lower band): Dynamic support zone.
Mid-bands (thin dotted red/blue): Halfway between median and outer bands, useful for scaling entries or partial exits.
🔹 EMA Ribbon (Light Green Shades)
Multiple EMAs (5, 8, 13, 21, 34) plotted in progressively lighter green.
Helps visualize momentum shifts and trend strength.
Ribbon turns more aqua/green when short-term EMAs align bullishly.
🙌Markers on Price
🔴 Red Circle (Dot): Short entry signal (price rejecting upper deviation band).
🔵 Blue Circle (Dot): Long entry signal (price bouncing off lower deviation band).
❌ Red X: Peak formation detected, potential short setup (not always valid).
🔷 Blue Diamond: Trough formation detected, potential long setup (not always valid).
Numbers Above/Below Candles
🔴Red numbers (above peaks): % spread from the bottom to the peak, showing upward volatility.
🔵 Blue numbers (below troughs): % spread from the top to the trough, showing downward volatility.
These values help traders gauge the strength of recent swings and compare volatility expansions.
🔹 Signal Logic🔹
🔵Long Signal (Blue Circle):
Forms when price makes a trough and crosses back above the lower regression band.
Confirms potential upside reversal with stop-loss guided by ATR or swing low.
🔴Short Signal (Red Circle):
Forms when price makes a peak and crosses below the upper regression band.
Confirms potential downside reversal with stop-loss guided by ATR or swing high.
❌ Peaks (Red X):
Indicate local tops. Not all peaks convert into shorts, but they warn of resistance zones.
🔹Troughs (Blue Diamonds):
Indicate local bottoms. Not all troughs convert into longs, but they warn of support zones.
🔹 Alerts
When a valid long or short setup is confirmed, an alert fires with:
Ticker name
Entry price
Suggested position size (Quantity)
Stop loss level (ATR-based or HL-based)
Take profit level (calculated by reward multiple)
🔹 Inputs & Customization
Quantity: Lot size suggestion.
Deviation: Multiplier for regression channel width.
Take Profit: Risk-to-reward multiplier.
Stop Loss: ATR or High/Low based.
Trend Lines: Choose between extended or fixed channels.
Period: Lookback window for regression.
Spread Percentages: Toggle volatility labels on/off.
🔹 How to Use
Trend Following: Ride price inside the channel using EMA ribbon alignment.
Reversal Trading: Enter at deviation extremes with confirmation signals.
Volatility Mapping: Use spread % labels to measure the strength of market swings.
Risk Management: ATR-based stops adapt to volatility, while HL stops give structural support/resistance.
✅ In summary:
The Ultimate Indicator is not just a regression channel—it’s a multi-layered system that highlights trend bias, entry/exit signals, volatility spreads, and adaptive risk levels. It allows traders to see at a glance whether the market is trending, ranging, or preparing for a reversal.

Trend-Strong Candle - 3 EMAs with Filters# Trend-Strong Candle - Professional Trading Indicator
## 📊 What It Does
Identifies high-probability entries by combining triple EMA trend analysis with strong candle detection. Only signals when all conditions align for maximum accuracy.
## 🎯 Core Features
- Triple EMA System: Fast (20) / Medium (50) / Slow (200) for trend confirmation
- Strong Candle Filter: ATR-based sizing ensures genuine momentum
- Advanced Filters: EMA close validation + trend stability checks
- Live Alerts: Instant notifications for real-time signals
- Session Filter: Trade only during active EU/US market hours
## ⚡ Quick Setup
Scalping (1-5min): Default settings + enable session filter
Day Trading (15-60min): Default settings work perfectly
Swing Trading (4H+): Increase ATR multiplier to 0.8-1.0
## 📈 Trading Rules
Long Signals: Green triangle below candle
- Strong bullish candle during confirmed uptrend
- All EMAs properly aligned (Fast > Medium > Slow)
Short Signals: Red triangle above candle
- Strong bearish candle during confirmed downtrend
- All EMAs properly aligned (Fast < Medium < Slow)
## ⚠️ Critical Success Factors
1. Always Verify the Trend Yourself
The indicator helps identify signals, but YOU must confirm the larger trend context. Check higher timeframes and overall market structure before entering.
2. Understand the "Big Players"
Strong candles in trend direction usually come from institutional money (banks, funds, algorithms). These create the momentum that retail traders can follow. The indicator catches these institutional moves.
3. Distance to Next Value Level
NEVER enter if price is too close to major resistance/support levels:
- Check distance to round numbers (1.1000, 1.1050, etc.)
- Ensure at least 20-30 pips room to next key level
- You need space for profit - tight levels = limited upside
4. Risk Management
- Stop Loss: 1-2 ATR from entry
- Take Profit: 2-3 ATR target (minimum 1:2 R/R)
- Position Size: Risk max 1-2% per trade
## 💡 Pro Tips
- Best Sessions: London open (8-12 UTC) and NY open (13-17 UTC)
- Avoid: Major news, low liquidity periods, choppy markets
- Multiple Timeframes: Confirm signals on higher timeframe
- Value Levels: Always check daily/weekly support/resistance before entering
## 🎯 Success Formula
Trend Confirmation + Strong Institutional Candle + Distance to Value Levels = High Probability Trade
*
Remember: The indicator finds the signals, but successful trading requires your analysis of trend context and value level positioning. Trade smart, not just frequent.

Weekly opening targets +-5%## Summary
This indicator automatically plots key percentage-based price levels above and below the current week's opening price. It is designed to provide traders with a clear map of potential intra-week support, resistance, and target zones based on clean, mathematical levels.
The script is lightweight and focuses on providing a clutter-free visual guide, making it easy to identify significant price areas at a glance.
## Features
Weekly Open Pivot: A central blue line clearly marks the opening price for the current week, acting as the primary baseline for all calculations.
Precise 1% Levels: The indicator calculates and draws horizontal lines at exact 1% increments away from the weekly open, covering a range from +/- 1% up to +/- 5%.
Color-Coded Zones: Levels above the weekly open are colored green (representing potential resistance or target zones), while levels below are colored red (representing potential support).
Real-Time Price Labels: To ensure clarity, clean labels are displayed on the right-hand side of the chart. Each label shows both its percentage deviation and the exact price, updating automatically with the latest data.
## How to Use
This tool is versatile, but here are a few common applications:
Identifying Support & Resistance: The primary use is to watch for price reactions at these calculated levels. A bounce off a lower (red) level could signal support, while a rejection from an upper (green) level could signal resistance.
Setting Profit Targets: The levels serve as excellent, non-subjective price targets. For example, if you enter a long position near the weekly open, the +1% and +2% levels are logical areas to consider taking profit.
Gauging Weekly Momentum: The distance price travels between these levels can help gauge the strength of the weekly trend. Consistently breaking through levels indicates strong momentum, while failing to do so may suggest consolidation.
This indicator is particularly useful for day traders and swing traders who use the weekly open as a key reference point for market sentiment and direction.

EMA + RSI Daily Bias Clarity Indi📊 EMA + RSI Daily Bias • Clarity Panel
This indicator is built for clarity, structure, and confidence in trading.
It combines EMAs, RSI, and a Daily Bias filter into one panel that helps you quickly understand trend, momentum, and alignment without cluttering your chart.
It does not provide signals or financial advice — instead, it simplifies your decision-making process by presenting conditions in a clear format.
🔧 Features
📈 Customizable EMAs (Fast & Slow)
Define short-term vs. medium-term trend direction.
Adjust the lengths for scalping, intraday, or swing trading.
🎯 RSI Integration
Tracks momentum on your active timeframe.
Highlights overbought (OB) and oversold (OS) conditions.
Used to filter entries and avoid chasing stretched moves.
🧭 Daily Bias (Higher Timeframe RSI)
Pulls RSI from the Daily chart (or chosen HTF).
Helps confirm if your local trade setup is aligned with higher timeframe momentum.
✨ Clarity Panel with Emojis
Displays Trend, HTF Bias, RSI reading, and State.
States include:
⏳ WAIT → No alignment or unclear conditions.
🟢 / 🔴 CONFIRM → Trend, RSI, and bias all align for a setup.
💰 COLLECT → RSI stretched to OB/OS, take partials or be cautious.
⚡ Optional Chart Markers
BUY/SELL labels appear when conditions align.
Alerts can be enabled for CONFIRM and COLLECT conditions.
💡 How to Use
Start with EMAs → Check if price is trending above or below EMAs to determine short-term direction.
Look at Daily Bias → See if RSI bias from higher timeframe (Daily by default) agrees with your local setup.
Check RSI → If RSI is neutral, WAIT. If RSI confirms momentum with trend + bias, CONFIRM. If RSI is stretched into OB/OS, COLLECT.
Use Panel for Quick Reads → The panel gives you a “dashboard” view of conditions so you don’t second-guess.
Combine with Your Own Strategy → This script is best used as a clarity filter to stay disciplined, not as a standalone signal generator.
📊 Example Workflow
Price above both EMAs ✅
Daily Bias shows BULL ✅
RSI at 62 (above midline, not yet overbought) ✅
→ Panel shows 🟢 CONFIRM → consider entering long.
Later, RSI rises to 72 (overbought) → Panel switches to 💰 COLLECT → take profits or tighten stops.
⚠️ Disclaimer
This script is for clarity and educational purposes only.
It does not provide financial advice, signals, or guaranteed profits.
Always use proper risk management and combine with your own trading plan.

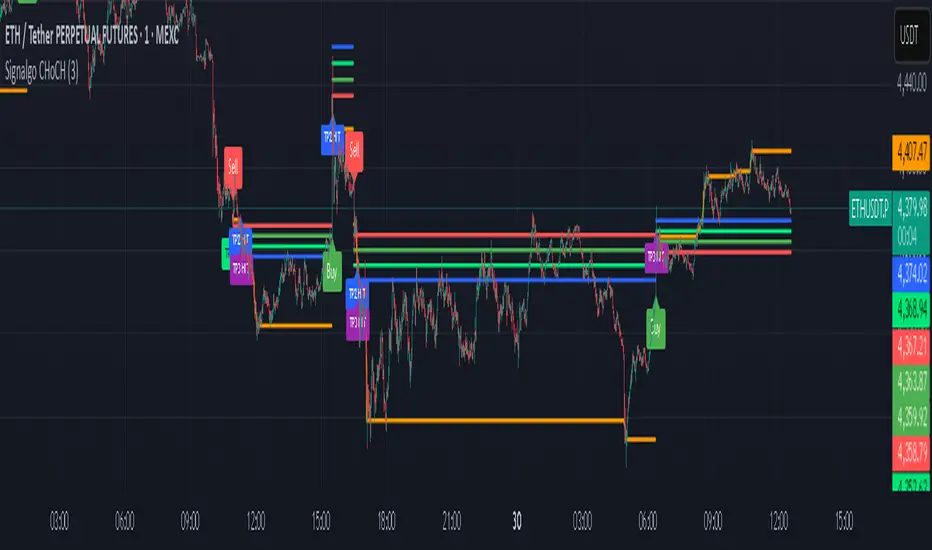
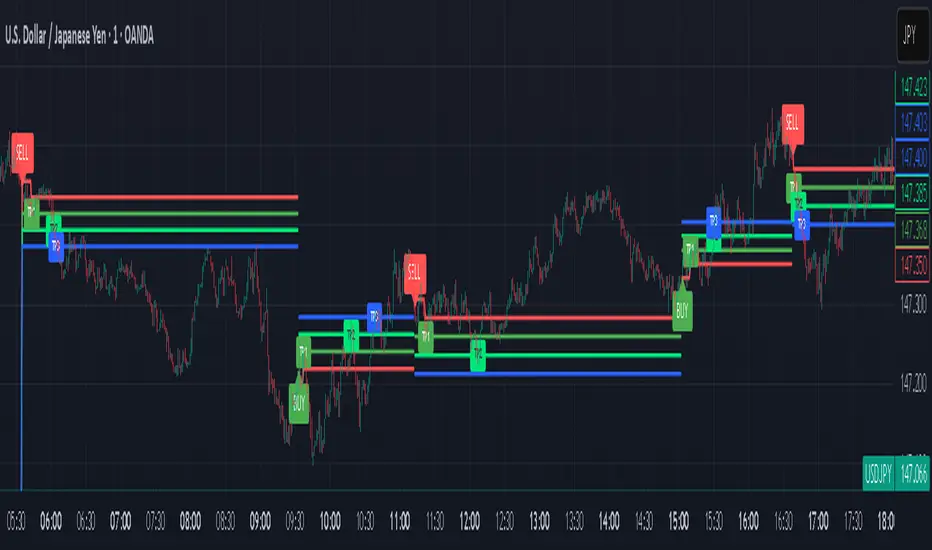
Signalgo CHoCHSignalgo CHoCH: Informative Technical Overview
Signalgo CHoCH is a multi-factor indicator designed for TradingView to detect “Change of Character” (CHoCH) shifts in market structure, signaling significant trend reversals and managing trades with risk control. This documentation details how it operates, its customizable parameters, signal methodology, what makes it different from traditional tools, and typical strategy applications.
How Signalgo CHoCH Works
1. Market Structure Detection
Swing High & Low Identification: The indicator uses an adaptive swing length to isolate important pivot highs and lows in price action. These pivots signal points where the market reversed direction or paused, forming the “swing structure” core to this strategy.
Body Strength Validation: Not every pivot break is meaningful. Signalgo CHoCH assesses price bar “body strength”—quantifying if the current candle’s body is disproportionately large compared to a recent average—to filter out weak or indecisive moves, retaining only those breaks likely to indicate genuine momentum.
2. Change of Character (CHoCH) Signal Logic
Bullish CHoCH: Triggered when price closes above the last significant swing low (the most recent support) with a strong candle body, indicating a transition from bearish to bullish market structure.
Bearish CHoCH: Triggered when price closes below the last significant swing high (key resistance) with a strong bearish candle, denoting a shift from bullish to bearish structure.
One-Time Event Recognition: Each break is tracked so that signals are issued only once per directional change, reducing repeated or redundant entries.
3. Higher Timeframe Confirmation
Multi-Timeframe Consistency: The indicator requires the CHoCH signal (on the current trading timeframe) to be confirmed by the market structure status of a selected higher timeframe. This adds an extra layer of validation, ensuring the signal aligns with broader trends.
Inputs
SwingLen: The number of bars used to define swing pivots.
bodyStrength & bodyLookback: Control sensitivity for body size validation, filtering which candle breaks are considered strong enough for signaling.
htfTf: Selects the higher timeframe for multi-timeframe checking.
show_tpsl: Toggle to show/hide automated Take Profit (TP) and Stop Loss (SL) levels on the chart.
ATR, TP/SL/RR/Trailing Settings: Determines how risk and reward are managed, using ATR for stop placement and multi-level profit targets with optional trailing stop activation after TP1.
Entry & Exit Strategy
Entry Logic
Long Entry: When a bullish CHoCH is detected, optionally confirmed by the higher timeframe, it marks a buy opportunity at the close of the breakout candle.
Short Entry: When a bearish CHoCH forms, also with optional higher timeframe confirmation, it identifies a sell entry at the close of the confirmation candle.
Exit & Trade Management
Stop Loss (SL): Automatically placed at a set ATR distance from entry, dynamically adapting to volatility.
Take Profits (TP1, TP2, TP3): Multiple reward targets are calculated and marked for systematic scaling out or profit-taking, based on a defined risk multiple.
Trailing Stop: Once the first profit target is hit, SL moves to breakeven, and a trailing stop engages, incrementally securing further gains if the trend continues.
State Tracking: All TP, SL, and trailing events are labeled on the chart for easy post-trade analysis.
Body Strength and Trend Filtering: Breakouts are only considered if the candle’s body confirms significant momentum, not just a fleeting spike, improving signal quality.
Event-Driven, Not Rolling: Each bullish or bearish “character change” is signaled only at the true point of structural shift, with strict per-event marking, not continuous signal generation as with typical MA cross strategies.
Integrated Multi-Timeframe Logic: higher timeframe validation minimizes false positives from short-term volatility noise, a capability not found in most indicator-based tools.
Automated, Dynamic Trade Management: This indicator overlays a complete trade management suite (TPs, SL, trailing) that moves with market conditions, allowing for risk handling directly from each signal.
Trading Strategy Application
Trend Reversal & Continuation: Suitable for identifying both sudden reversals and structural continuations, adaptable for intraday, swing, or positional trading styles.
Noise Filtering: Multiple checks (body strength, momentum, multi-timeframe) focus signals on genuine trend changes, filtering out most “whipsaws” seen in pure MA systems.
Visual Feedback: All transitions, TPs, SLs, and trailing events are visually annotated, enhancing the educational and review process.
Signalgo VSignalgo V: Technical Overview and Unique Aspects
Signalgo V is a technical indicator for TradingView that integrates multiple layers of analysis: moving averages, MACD, Bollinger Bands and RSI to deliver buy and sell signals. Below is an informational breakdown of how the indicator functions, its input parameters, signal logic, exit methodology, and how it stands apart from traditional moving average (MA) tools, without disclosing specifics that allow for code duplication.
How Signalgo V Works
1. Multi-Layered Technical Synthesis
Signalgo V processes several technical studies simultaneously:
Fast/Slow Moving Averages: Uses either EMA or SMA (user-selected) with adjustable periods. These are central to initial trend detection through crossovers.
MACD Filter: MACD line vs. signal line cross-check ensures trend direction is supported by both momentum and MA structure.
RSI Confirmation: The RSI is monitored to verify that signals are not excessively overbought or oversold, tuning the system to changing momentum regimes.
Bollinger Bands Context: Entry signals are only considered when price action is beyond the Bollinger Bands envelope, which further filters for unusually strong movements.
These strict, multi-indicator entry criteria are designed to ensure only the most robust signals are surfaced, each is contingent on the presence of aligned trend, momentum and volatility.
2. Exit Methodology
Take-Profit Levels: After entering a trade, the strategy automatically sets three predefined profit targets (TP1, TP2, TP3). If the price reaches any of these targets, the system marks it, helping you lock in profits at different stages.
Stop-Loss System: Simultaneously, a stop-loss (SL) value is set, protecting you from significant losses if the market moves against your position.
Dynamic Adjustment: When the first profit target (TP1) is hit, the system can automatically move the stop-loss to your entry price. This means your worst-case outcome is break-even from that point, reducing downside risk.
Trailing Stop-Loss: After TP1 is reached, a dynamic trailing stop can activate. This allows the stop-loss to follow the price as it moves in your favor, aiming to capture more profit if the trend continues, while still protecting your gains if the price reverses.
Visual Markers: The system plots all important exit levels (profit targets, stop-loss, trailing stop) directly on the chart. Optional labels also appear whenever a target or stop-loss is hit, making it easy to see progress.
Visual cues (labels) are plotted directly on the bar where a buy or sell signal triggers, clarifying entry points and aiding manual exit/risk management decisions.
Input Parameters
rsiLen: Lookback period for RSI calculation.
rsiOB and rsiOS: Overbought/oversold thresholds, adaptive to the indicator’s multi-layered logic.
maFastLen and maSlowLen: Periods for fast and slow MAs.
maType: EMA or SMA selectable for both MAs.
bbLen: Length for Bollinger Bands mean calculation.
bbMult: Standard deviation multiplier for BB width.
macdFast, macdSlow, macdSig: Standard MACD parameterization for nuanced momentum oversight.
What Separates Signalgo V from Traditional Moving Average Indicators
Composite Signal Architecture: Where traditional MA systems generate signals solely on MA crossovers, Signalgo V requires layered, cross-confirmational logic across trend (MAs), momentum (MACD), volatility (Bollinger Bands), and market strength (RSI).
Adaptive Volatility Context: MA signals only “count” when price is meaningfully breaking out of its volatility envelope, filtering out most unremarkable crosses that plague basic MA strategies.
Integrated Multi-Factor Filters: Strict compliance with all layers of signal logic is enforced. A marked improvement over MA strategies that lack secondary or tertiary confirmation.
Non-Redundant Event Limiting: Each entry is labeled as a unique event. The indicator does not repeat signals on subsequent bars unless all entry conditions are freshly met.
Trading Strategy Application
Trend Identification: By requiring concurrence among MA, MACD, RSI, and BB, this tool identifies only those trends with robust, multifactor support.
Breakout and Momentum Entry: Signals are bias-toward trades that initiate at likely breakout points (outside BB range), combined with fresh momentum and trend alignment.
Manual Discretion for Exits: The design is to empower traders with high-confidence entries and leave risk management or partial profit-taking adaptive to trader style, using visual cues from all component indicators.
Alert Generation: Each buy/sell event optionally triggers an alert, supporting systematic monitoring without constant chart watching.
Sunmool's Silver Bullet Model FinderICT Silver Bullet Model Indicator - Complete Guide
📈 Overview
The ICT Silver Bullet Model indicator is a supplementary tool for utilizing ICT's (Inner Circle Trader) market structure analysis techniques. This indicator detects institutional liquidity hunting patterns and automatically identifies structural levels, helping traders analyze market structure more effectively.
🎯 Core Features
1. Structural Level Identification
STL (Short Term Low): Recent support levels formed in the short term
STH (Short Term High): Recent resistance levels formed in the short term
ITL (Intermediate Term Low): Stronger support levels with more significance
ITH (Intermediate Term High): Stronger resistance levels with more significance
2. Kill Zone Time Display
London Kill Zone: 02:00-05:00 (default)
New York Kill Zone: 08:30-11:00 (default)
These are the most active trading hours for institutional players where significant price movements occur
3. Smart Sweep Detection
Bear Sweep (🔻): Pattern where price sweeps below lows then recovers - Simply indicates sweep occurrence
Bull Sweep (🔺): Pattern where price sweeps above highs then declines - Simply indicates sweep occurrence
Important: Sweep labels only mark liquidity hunting locations, not directional bias.
🔧 Configuration Parameters
Basic Settings
Sweep Detection Lookback: Number of candles for sweep detection (default: 20)
Structure Point Lookback: Number of candles for structural point detection (default: 10)
Sweep Threshold: Percentage threshold for sweep validation (default: 0.1%)
Time Settings
London Kill Zone: Active hours for London session
New York Kill Zone: Active hours for New York session
Visualization Settings
Customizable colors for each level type
Enable/disable alert notifications
📊 How to Use
1. Chart Setup
Most effective on 1-minute to 1-hour timeframes
Recommended for major currency pairs (EUR/USD, GBP/USD, etc.)
Also applicable to cryptocurrencies and indices
2. Signal Interpretation
🔻 Bear Sweep / 🔺 Bull Sweep Labels
Simply indicate liquidity hunting occurrence points
Not directional bias indicators
Reference for understanding overall context on HTF
🟢 Silver Bullet Long (Huge Green Triangle)
After Bear Sweep occurrence
Within Kill Zone timeframe
Current price positioned above swept level
→ Actual BUY entry signal
🔴 Silver Bullet Short (Huge Red Triangle)
After Bull Sweep occurrence
Within Kill Zone timeframe
Current price positioned below swept level
→ Actual SELL entry signal
3. Risk Management
Use swept levels as stop-loss reference points
Approach signals outside Kill Zone hours with caution
Recommended to use alongside other technical analysis tools
💡 Trading Strategies
Silver Bullet Strategy
Preparation Phase: Monitor charts 30 minutes before Kill Zone
Sweep Observation: Identify liquidity hunting points with 🔻🔺 labels (reference only)
Entry: Enter ONLY when huge triangle Silver Bullet signal appears within Kill Zone
Take Profit: Target opposite structural level or 1:2 reward ratio
Stop Loss: Beyond the swept level
Important: Small sweep labels are NOT trading signals!
Multi-Timeframe Approach
Step 1: HTF (Higher Time Frame) Sweep Reference
Observe 🔻🔺 sweep labels on 4-hour and daily charts
Reference only sweeps occurring at major structural levels
HTF sweeps are used to identify liquidity hunting points
Reference only, not for directional bias
Step 2: Transition to LTF (Lower Time Frame)
Move to 15-minute, 5-minute, and 1-minute charts
Analyze LTF with reference to HTF sweep information
Use STL, STH, ITL, ITH for precise entry point identification
Structural levels on LTF are the core of actual trading decisions
Only huge triangle (Silver Bullet) signals are actual entry signals
Recommended Usage
Identify overall sweep occurrence points on HTF (🔻🔺 labels)
Use this indicator on LTF to identify structural levels
Reference only huge triangle signals for actual trading during Kill Zone
Small sweep labels (🔻🔺) are for reference only, not entry signals
📋 Information Table Interpretation
Real-time information in the top-right table:
Kill Zone Status: Current active session status
Level Counts: Number of each structural level type
⚠️ Important Disclaimers
Backtesting results do not guarantee future performance
Exercise caution during high market volatility periods
Always apply proper risk management
Recommend comprehensive analysis with other analytical tools
🎓 Learning Resources
Study original ICT concepts through free YouTube educational content
Research Market Structure analysis techniques
Optimize through backtesting for personal use
🔬 Technical Implementation
Algorithm Logic
Pivot Point Detection: Uses TradingView's built-in pivot functions to identify swing highs and lows
Classification System: Automatically categorizes levels based on recent price action frequency
Sweep Validation: Confirms legitimate sweeps through price action analysis
Time-Based Filtering: Prioritizes signals during institutional active hours
Performance Optimization
Efficient array management prevents memory overflow
Dynamic level cleanup maintains chart clarity
Real-time calculation ensures minimal lag
🛠️ Customization Tips
Adjust lookback periods based on market volatility
Modify kill zone times for different market sessions
Experiment with sweep threshold for different instruments
Color-code levels according to personal preference
📈 Expected Outcomes
When properly implemented, this indicator can help traders:
Identify high-probability reversal points
Time entries with institutional flow
Reduce false signals through kill zone filtering
Improve risk-to-reward ratios
This indicator automates ICT's concepts into a user-friendly tool that can be enhanced through continuous learning and practical application. Success depends on understanding the underlying market structure principles and combining them with proper risk management techniques.

ICT OTE (Optimal Trade Entry) IndicatorWhat This Indicator Does:
This is an ultra-clean ICT (Inner Circle Trader) indicator that shows only ONE high-probability signal at a time when multiple confluences perfectly align. It eliminates chart clutter and focuses on the absolute best trading opportunities.
How It Takes Positions:
🔍 Signal Requirements (ALL Must Align):
Market Structure Break - Significant swing high/low break with volume confirmation
Fair Value Gap (FVG) - Large price imbalance/gap (minimum 0.5% size)
Order Block - Institutional supply/demand zone from recent rejection candle
OTE Sweet Spot - Price retraces to 70.5% Fibonacci level (optimal entry zone)
Volume Confirmation - 50% above 50-bar average volume
Rejection Candle - Proper candle formation showing rejection at the level
📊 Position Entry Logic:
BUY Signal Triggers When:
Price breaks above a significant swing high (bullish structure break)
Price retraces back down into a Fair Value Gap or Order Block
Retracement reaches exactly the 70.5% optimal level
Volume spike confirms institutional interest
Rejection candle forms (closes higher than it opened during retracement)
No other signal has been active in the last 50 bars (cooldown system)
SELL Signal Triggers When:
Price breaks below a significant swing low (bearish structure break)
Price retraces back up into a Fair Value Gap or Order Block
Retracement reaches exactly the 70.5% optimal level
Volume spike confirms institutional interest
Rejection candle forms (closes lower than it opened during retracement)
No other signal has been active in the last 50 bars (cooldown system)
⚡ Key Features:
Ultra-Strict Filtering: Only 2-4 signals per month on average (quality over quantity)
One Signal Rule: Only one active signal at a time - no confusion
50-Bar Cooldown: Prevents signal spam and overtrading
Perfect Confluence: Requires 3+ ICT concepts to align simultaneously
Clean Chart: No boxes, lines, or visual clutter - just clear BUY/SELL labels
🎯 Trading Strategy:
Wait for Signal: Large BUY or SELL label appears on chart
Entry: Enter immediately when signal appears (all confluences already confirmed)
Stop Loss: Place beyond the Fair Value Gap or Order Block (typically 1-2% risk)
Take Profit: Target previous swing high/low or major liquidity levels
Risk Management: Only trade when signal appears - no guessing or early entries
💡 Why It Works:
This indicator combines ICT's most powerful concepts (market structure, FVGs, order blocks, optimal retracements) into one confluence-based system. It only signals when institutional money is likely moving, giving you the highest probability entries with minimal noise.
Perfect for: Swing traders, day traders, and anyone wanting clean, high-probability ICT signals without chart clutter.
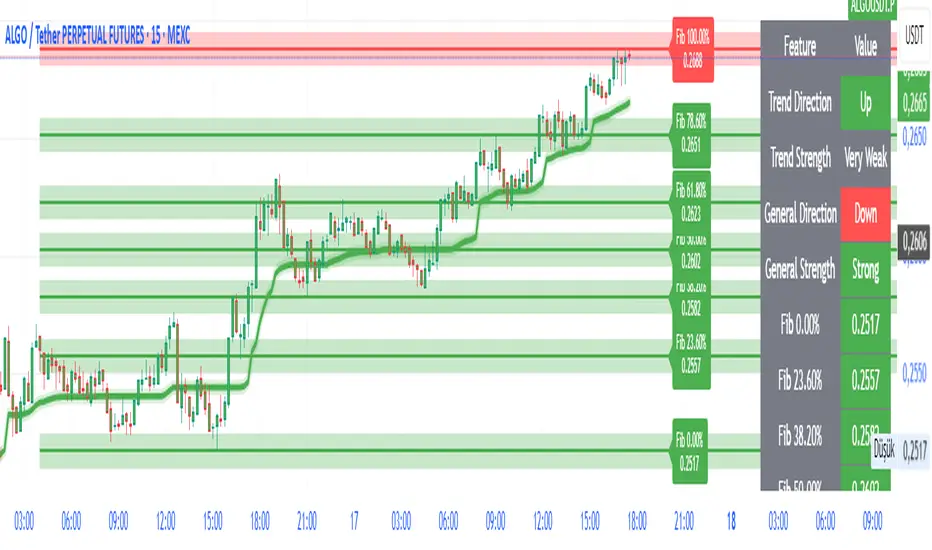
FibroTrend Matrix Premium [By TraderMan]📊 FibroTrend Matrix Premium
FibroTrend Matrix Premium is a powerful multi-timeframe trend and Fibonacci analysis tool. It combines trend direction, trend strength, and key Fibonacci levels into a single, clean interface with a dynamic table. Perfect for traders who want to see the market structure at a glance.
🧠 How It Works
Trend Detection 📈📉
Uses EMA-based dynamic bands to determine current trend direction.
Computes trend strength using slope of the trend line vs. price deviation.
Works on multiple timeframes (5m, 15m, 30m, 1h, 4h, 1D) for overall market context.
Fibonacci Levels & Zones 🔢
Automatically draws key Fibonacci retracement levels (0, 0.236, 0.382, 0.5, 0.618, 0.786, 1.0).
Adds zones around levels for potential support/resistance areas.
Labels are small and clear, lines slightly thicker for better visibility.
Trend Table Summary 📊
Shows current trend direction, strength, and general trend across multiple timeframes.
Fibonacci levels are included in the table with color-coded cells (green = bullish, red = bearish).
⚡ How to Use / Trading Logic
Identify Trend Direction
Uptrend (Green/“Up”) → look for buying opportunities.
Downtrend (Red/“Down”) → look for selling/shorting opportunities.
Neutral → wait or stay out.
Check Trend Strength
Very Strong / Strong (Green) → trend likely to continue.
Weak / Very Weak (Red) → trend may reverse or be choppy.
Use Fibonacci Levels for Entry & Exit
Enter near support zones in an uptrend.
Enter near resistance zones in a downtrend.
Use zone width & tolerance to set stop-loss or take-profit.
Multi-Timeframe Confirmation ✅
Ensure majority of timeframes confirm trend direction for stronger signal.
Example: if 5 out of 6 timeframes show Uptrend, trend is strong.
💡 Tips
Combine with volume, momentum, or RSI for extra confirmation.
Avoid trading solely on Fibonacci levels; use trend + strength table as main guide.
Works well for swing trading, intraday, and crypto markets.
🎯 Entry Example
Price is in an uptrend (green bars, line up).
Fibonacci retracement 0.382 aligns with support zone.
Trend strength = Strong or Very Strong.
Enter Long near zone, set stop-loss slightly below zone, take-profit near next Fibonacci level.
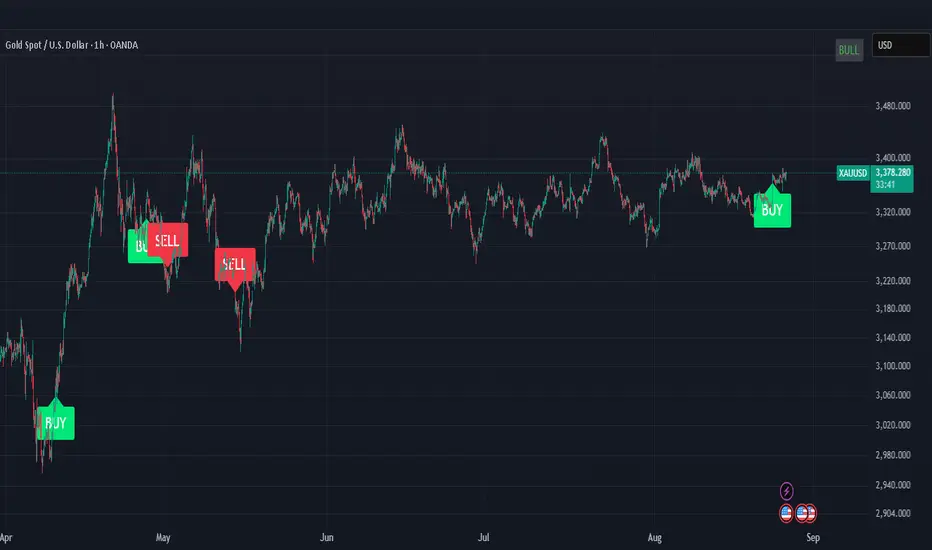
Price Acceleration Matrix [QuantAlgo]🟢 Overview
The Price Acceleration Matrix indicator is an advanced momentum analysis tool that measures the rate of change in price velocity across multiple timeframes simultaneously. It transforms raw price data into velocity measurements for each timeframe, then calculates the acceleration of these velocities to identify when momentum is building or deteriorating. By analyzing acceleration alignment across all three timeframes, the system can distinguish between strong directional moves (all timeframes accelerating in the same direction) and weak, choppy movements (mixed acceleration signals). This multi-timeframe acceleration matrix provides traders with early warning signals for momentum shifts, trend continuation and reversal opportunities across different timeframes and asset classes.
🟢 How It Works
The indicator employs a three-stage calculation process that transforms price data into actionable acceleration signals. First, it calculates velocity (rate of price change) for each of the three user-defined timeframes by measuring the percentage change in price over the specified lookback periods. These velocity calculations are normalized by their respective timeframe lengths to ensure fair comparison across different periods.
In the second stage, the system calculates acceleration by measuring the change in velocity from one bar to the next for each timeframe, effectively capturing the second derivative of price movement. This acceleration data reveals whether momentum is building (positive acceleration) or deteriorating (negative acceleration) at each timeframe level.
The final stage creates the acceleration matrix score by evaluating alignment across all three timeframes. When all timeframes show positive acceleration, the system averages them for maximum bullish signal strength. When all show negative acceleration, it averages them for maximum bearish signal strength. However, when acceleration signals are mixed across timeframes, the system applies a penalty by dividing the average by two, indicating consolidation or conflicting momentum forces. The resulting signal is then smoothed using an Exponential Moving Average and scaled to the -3 to +3 range using a user-defined threshold parameter.
🟢 How to Use
1. Signal Interpretation and Momentum Analysis
Positive Territory (Above Zero): Indicates accelerating upward momentum with bullish bias and favorable conditions for long positions
Negative Territory (Below Zero): Signals accelerating downward momentum with bearish bias and favorable conditions for short positions
Extreme Levels (±2 to ±3): Represent maximum acceleration alignment across all timeframes, indicating high-probability momentum continuation
Moderate Levels (±1 to ±2): Suggest building momentum with good timeframe alignment but less conviction than extreme readings
Near Zero (-0.5 to +0.5): Indicates mixed signals, consolidation, or momentum exhaustion requiring caution
2. Overbought/Oversold Zone Analysis
Above +2 (Overbought Zone): Markets showing extreme bullish acceleration may be due for profit-taking or short-term pullbacks
Below -2 (Oversold Zone): Markets showing extreme bearish acceleration may present reversal opportunities or bounce potential
Zone Exits: When acceleration retreats from extreme zones, it often signals momentum exhaustion and potential trend changes
🟢 Pro Tips for Trading
→ Early Momentum Detection: Watch for acceleration crossing above zero after periods of negative readings, as this often precedes major price movements by several bars, providing early entry opportunities before traditional indicators signal.
→ Momentum Exhaustion Signals: Exit or take profits when acceleration reaches extreme levels (±2.5 or higher) and begins to decline, even if price continues in the same direction, as momentum deterioration typically precedes price reversals.
→ Acceleration Divergence Strategy: Look for divergences between price highs/lows and acceleration peaks/troughs, as these often signal weakening momentum and potential reversal opportunities before they become apparent on price charts.
→ Threshold Optimization: Adjust the acceleration threshold based on asset volatility - higher thresholds (0.7-1.0) for volatile assets to reduce false signals, lower thresholds (0.3-0.5) for stable assets to maintain sensitivity.
→ Alert-Based Trading: Utilize the built-in alert system for bullish/bearish reversals (±2 level crosses) and trend changes (zero line crosses) to capture momentum shifts without constant chart monitoring, especially effective for swing trading approaches.
→ Risk Management Integration: Reduce position sizes when acceleration readings are weak (below ±1.0) and increase allocation when strong acceleration alignment occurs (above ±2.0), as signal strength correlates directly with probability of successful trades.

Elliott Wave - Impulse + Corrective Detector (Demo) เทคนิคการใช้
สำหรับมือใหม่
ดูเฉพาะ Impulse Wave ก่อน
เทรดตาม direction ของ impulse
ใช้ Fibonacci เป็น support/resistance
สำหรับ Advanced
ใช้ Corrective Wave หาจุด reversal
รวม Triangle กับ breakout strategy
ใช้ Complex correction วางแผนระยะยาว
⚙️ การปรับแต่ง
ถ้าเจอ Pattern น้อยเกินไป
ลด Swing Length เป็น 3-4
เพิ่ม Max History เป็น 500
ถ้าเจอ Pattern เยอะเกินไป
เพิ่ม Swing Length เป็น 8-12
ปิด patterns ที่ไม่ต้องการ
สำหรับ Timeframe ต่างๆ
H1-H4: Swing Length = 5-8
Daily: Swing Length = 3-5
Weekly: Swing Length = 2-3
⚠️ ข้อควรระวัง
Elliott Wave เป็น subjective analysis
ใช้ร่วมกับ indicators อื่นๆ
Backtest ก่อนใช้เงินจริง
Pattern อาจเปลี่ยนได้ตลอดเวลา
🎓 สรุป
โค้ดนี้เป็นเครื่องมือช่วยวิเคราะห์ Elliott Wave ที่:
✅ ใช้งานง่าย
✅ ตรวจจับอัตโนมัติ
✅ มี confidence scoring
✅ แสดงผล Fibonacci levels
✅ ส่ง alerts เรียลไทม์
เหมาะสำหรับ: Trader ที่ต้องการใช้ Elliott Wave ในการวิเคราะห์เทคนิค แต่ไม่มีเวลานั่งหา pattern เอง
💡 Usage Tips
For Beginners
Focus on Impulse Waves first
Trade in the direction of impulse
Use Fibonacci as support/resistance levels
For Advanced Users
Use Corrective Waves to find reversal points
Combine Triangles with breakout strategies
Use Complex corrections for long-term planning
⚙️ Customization
If You See Too Few Patterns
Decrease Swing Length to 3-4
Increase Max History to 500
If You See Too Many Patterns
Increase Swing Length to 8-12
Turn off unwanted pattern types
For Different Timeframes
H1-H4: Swing Length = 5-8
Daily: Swing Length = 3-5
Weekly: Swing Length = 2-3
⚠️ Important Warnings
Elliott Wave is subjective analysis
Use with other technical indicators
Backtest before using real money
Patterns can change at any time
🔧 Troubleshooting
No Patterns Showing
Check if you have enough price history
Adjust Swing Length settings
Make sure pattern detection is enabled
Too Many False Signals
Increase confidence threshold requirements
Use higher timeframes
Combine with trend analysis
Performance Issues
Reduce Max History setting
Turn off unnecessary visual elements
Use on liquid markets only
📈 Trading Applications
Entry Strategies
Wave 3 Entry: After Wave 2 completion (61.8%-78.6% retracement)
Wave 5 Target: Equal to Wave 1 or Fibonacci extensions
Corrective Bounce: Trade reversals at C wave completion
Risk Management
Stop Loss: Beyond pattern invalidation levels
Take Profit: Fibonacci extension targets
Position Sizing: Based on pattern confidence
🎓 Summary
This code is an Elliott Wave analysis tool that offers:
✅ Easy to use interface
✅ Automatic pattern detection
✅ Confidence scoring system
✅ Fibonacci level display
✅ Real-time alerts
Perfect for: Traders who want to use Elliott Wave analysis but don't have time to manually identify patterns.
📚 Quick Reference
Pattern Hierarchy (Most to Least Reliable)
Impulse Waves (90% confidence)
Expanded Flats (85% confidence)
Zigzags (80% confidence)
Triangles (75% confidence)
Complex Corrections (70% confidence)
Best Practices
Start with higher timeframes for main trend
Use lower timeframes for precise entries
Always confirm with volume and momentum
Don't trade against strong fundamental news
Keep a trading journal to track performance
Remember: Elliott Wave is an art as much as a science. This tool helps identify potential patterns, but always use your judgment and additional analysis before making trading decisions.

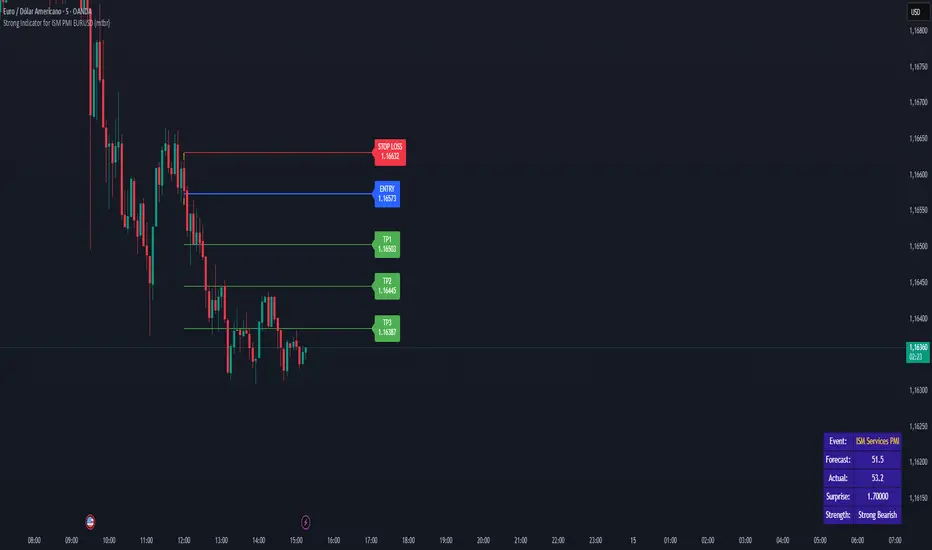
Strong Indicator for ISM PMI EURUSD (mtbr)Overview:
This indicator is designed for EURUSD traders who want to analyse the market's reaction to the ISM Services PMI economic event. It automatically detects the event candle, calculates the “surprise” between Actual and Forecast, and generates a full trading plan with entry, take profit, and stop loss levels.
How it works:
Set the event time (or a custom date/time) and input Forecast, Previous, and Actual values.
The indicator calculates the surprise: Actual − Forecast.
Based on the surprise magnitude, it classifies the strength as Weak, Moderate, or Strong, and as Bullish or Bearish.
Direction is set automatically but can be inverted via the “Invert Signal Logic” option.
Entry, TP1, TP2, TP3, and SL are calculated based on your percentage settings.
Levels are plotted on the chart, with labels and a vertical dashed line marking the event candle.
A table displays key event data: name, forecast, actual, surprise, and strength classification.
How to use:
Select your trading asset (EURUSD by default).
Choose between automatic event time logic or a custom date/time.
Input the Forecast, Previous, and Actual values from the economic calendar.
Adjust percentage settings for entry, take profits, and stop loss.
Use the plotted lines as a reference for trade planning.
Optionally enable pullback confirmation before entry.
Disclaimer:
This tool is for educational and analytical purposes only. It is not financial advice. Always use proper risk management and perform independent analysis before trading.